

Key takeaways
- HEART names five categories of UX metrics, and its authors say not every product needs all five: it needs an explicit decision about each.
- The work is in the signal: it should move when the experience gets better or worse, and not for unrelated reasons.
- On a film club's membership page, Retention decides: sign-ups bought by selling the calendar harder bring members who stop coming.
- Give each letter one signal and one sentence on the alternative you dropped; that sentence is what makes the grid defensible.
- Practise on one brief: five lines, one signal per letter, the deciding letter circled and what you do if it disagrees.
The HEART framework is Google's set of five categories for user experience metrics: Happiness, Engagement, Adoption, Retention and Task success. Kerry Rodden, Hilary Hutchinson and Xin Fu published it in 2010, with a process that runs from goals to signals to metrics. Filled in whole, it produces a grid nobody acts on. The useful version picks one signal per letter and names the letter that decides.
Its authors said as much. The paper notes that it is not always appropriate to use metrics from every category, and that the point of the framework is to make an explicit decision about including or excluding each one. That decision is the skill. Here is how to make it on a real brief, a monthly film club, where one letter outranks the other four.
What each letter measures
Happiness is attitudinal: satisfaction, likelihood to recommend, perceived ease of use, usually read through a repeated survey. Engagement is how deeply people use the product over a period. The paper's example is Gmail: the share of weekly users who visited on five or more days, since an engaged user checks email as a routine.
Adoption counts the new people who start using a product or feature in a period. Retention counts how many of the people from one period are still there in a later one. Task success covers the traditional usability measures: efficiency, such as time to finish a task, effectiveness, such as the share of tasks completed, and error rate.
Two notes from the paper prevent common mistakes. Report Engagement as an average per person, not a total, because a total rises when more people arrive, not when they use the product more. And Adoption and Retention exist to separate new people from returning ones: a spike in visitors means little until you know which of the two caused it.
Goals, signals, metrics: where the work is
HEART names categories, not numbers, and the paper pairs it with a three-step process. First the goal: what is this product or redesign trying to achieve, in terms of what people do? Then the signal: what action or attitude would show the goal was met, or missed? Only then the metric: the signal turned into a ratio or an average you can track over time.
The signal is the step that decides whether the grid gets used. The paper's test is that a signal should be sensitive and specific to the goal: it moves when the experience gets better or worse, and not for unrelated reasons. Most candidate signals fail that test, which is why five letters with four signals under each look thorough and decide nothing.
The brief: a film club that argues a position
Reel Heretics is one of the practice briefs on Quest: a five-year-old film club in Mexico City with two curated screenings a month in a 90-seat independent cinema and around 400 paying yearly members. Each month's pair of films is published as an essay that argues a point about cinema, and members get post-screening discussions with invited critics.
The problem is the membership page. It lists screenings the way a cinema does, so a visitor who came for one film assumes this is just another arthouse cinema. The brief says members are loyal once they join. The page's job is to turn one-screening visitors into yearly members by putting the club's point of view above the calendar, so that joining reads as a statement of taste.
Which letter decides: Retention
The obvious lead is Adoption: the page exists to sign people up, so count sign-ups. But a page can raise sign-ups by selling the calendar harder, with bigger posters, a discount and something for everyone. That is the version the brief's tone is allergic to, and it recruits people who joined for one film and stop coming when the next pairing is not to their taste.
So the letter that decides is Retention. The page has done its job only if the people it recruits keep turning up once the novelty is gone, because they signed onto the argument and not the listing. Adoption is the volume; Retention says whether the volume was worth having. When the two disagree, Retention wins the argument.
There is a timing problem. A yearly renewal is the final verdict, and it arrives a year after the redesign. The paper leaves the window to you, so pick the club's own rhythm: with two screenings a month, a member who has drifted shows up as absent within a quarter.

One signal per letter, and why the others are out
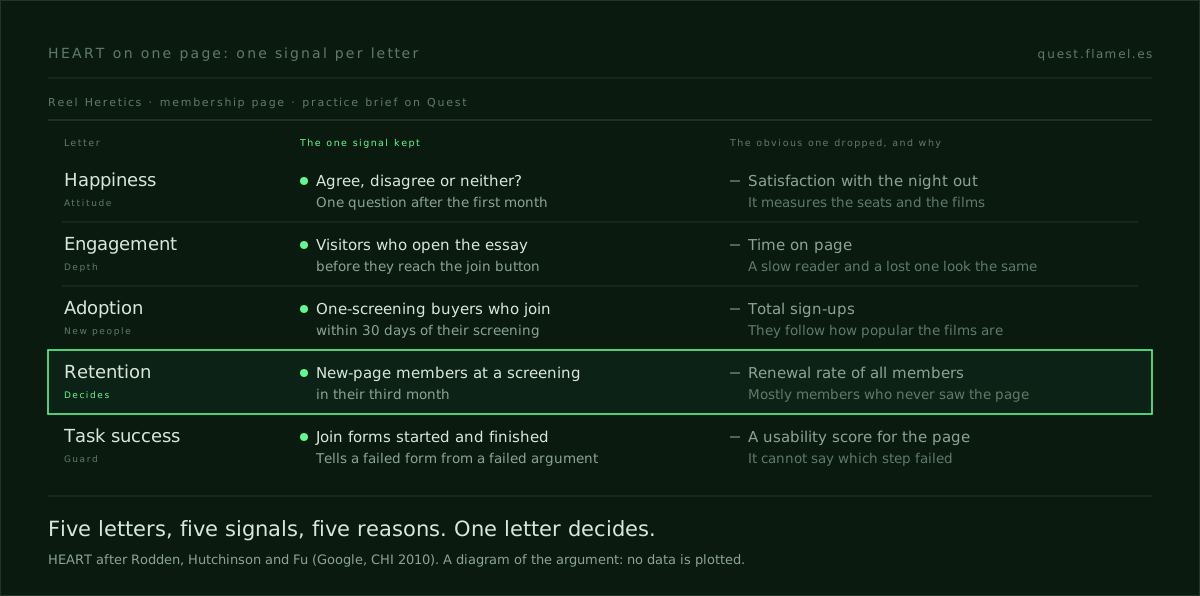
The grid for the membership page: one signal per letter, and the sentence that rules out the obvious alternative.
- Retention, the lead: the share of members who joined through the new page and attend at least one screening or discussion in their third month. Not the renewal rate of all 400 members, which mostly measures years of loyal members who never saw the new page.
- Adoption: the share of single-screening ticket buyers who become yearly members within 30 days of their screening. Not total sign-ups, which rise and fall with how popular the month's films are.
- Engagement: the share of page visitors who open the month's essay before they reach the join button. Not time on page, where a slow reader and a lost one look identical.
- Happiness: one question to new members after their first month, asking whether the club argues something they agree with, disagree with or neither. Not a satisfaction score for the night out, which measures the seats and the films. A rising share of "neither" means the page is selling a calendar again.
- Task success: the share of people who start the join form and finish it. Not a usability score for the page. It is a guard: if Adoption falls, you need to know whether the argument failed or the payment step did.
Every signal is a ratio and every one names its population, which is the paper's advice on turning signals into metrics. It is also the discipline behind one number per customer moment: a number nobody can pin to a group of people is a number anybody can argue with.
Why the dropped signals matter
The sentence about what you left out is what makes the grid defensible. Anyone in a review can propose a sixth signal. A reason already written down turns that into a short conversation instead of a longer dashboard, and it guards against a metric that moves for reasons unrelated to your design.
A whole letter can go: in an enterprise tool people must use for work, Engagement may mean little, the paper says. But only on purpose. Write "none" and the reason, so the gap reads as a decision, not an oversight.
HEART supplies the letter and the signal. Why your design should move that signal has to come from you.
Where the mechanism comes from
A signal is only as good as your idea of why the design should change behaviour. On the film club page, opening the essay is the Engagement signal because the essay is the mechanism: the bet is that the visitor who reads the club's argument and wants to answer it is the member still there in month three. If you cannot name the mechanism, you cannot say which signal is sensitive to it.
Every page in the Quest skills library ends with a note on what to measure for exactly this reason. The one for insight, the moment a user realises something true about themselves, is a small lesson in choosing signals: track completion of the diagnostic alongside the share of people who share or screenshot the result, then check that outcomes vary across users. If they do not, the mechanic is theatre.
Try it on one brief this week
Take one product you work on, or one practice brief, and write five lines: one signal per letter, each followed by the alternative you dropped and why. Then circle the letter that decides and write what you will do if it disagrees with the other four. If two letters both claim the lead, the goal is not settled yet, and that is the conversation to have before anyone opens a dashboard.
When the grid holds up, take the deciding signal into your next review as the last part of a decision you can defend. The rest of that sentence, the change and the mechanism behind it, is in how to defend a design decision.
You are a growth design lead reviewing my metrics plan before it goes to the team. The product and the change: [describe the product, the screen you are redesigning and what it should achieve]. The people it touches: [who uses it and how often they should come back]. Using HEART (Happiness, Engagement, Adoption, Retention, Task success), give me: 1) the goal of this change in one sentence, in terms of what people do; 2) for each letter, one signal only, written as a ratio or an average with its population and timeframe, followed by the most obvious alternative signal and one sentence on why it is out; 3) any letter that should get no signal, with the reason; 4) the one letter that decides when the others disagree, and why. Be strict: reject any signal that would move for reasons unrelated to the design, and any raw total that grows just because more people arrive.
Frequently asked questions
What is the HEART framework?
HEART is a set of five categories for user experience metrics: Happiness, Engagement, Adoption, Retention and Task success. Kerry Rodden, Hilary Hutchinson and Xin Fu created it at Google and published it at CHI 2010. Teams use the categories to choose specific metrics through a process that goes from the goal, to the signal that shows it was met, to the metric that tracks it.
What is the difference between HEART and PULSE metrics?
PULSE stands for Page views, Uptime, Latency, Seven-day active users and Earnings: the business and technical numbers many teams already track. They matter, but they say little about the quality of the experience or what to change. HEART was created to complement them, with categories that describe how people experience the product rather than how much traffic it gets.
Do you have to use all five HEART metrics?
No. The original paper says it is not always appropriate to use metrics from every category; the point is to decide explicitly whether each one is in or out. Engagement, for example, may mean little in an enterprise tool people must use for work. Write the reason next to any letter you exclude, so the gap reads as a decision.
What is a signal in the goals, signals, metrics process?
A signal is the action or attitude that would show a goal was met or missed, before it becomes a number. Good signals are sensitive and specific: they move when the experience gets better or worse and not for unrelated reasons. Failure is sometimes easier to spot than success, through abandoned tasks, undo actions or visible frustration.
How is Retention different from Engagement in HEART?
Engagement measures how deeply people use a product within a period, such as visits per person per week, and is best reported as an average per person. Retention measures how many of the people from one period are still there in a later one. A product can show intense engagement from a shrinking group, and only Retention reveals that.